RET18 (Dr. Hui Zhang Lab): Visualize and Analyze Time-series IoT Data
Project Duration (expected): June 18 – July 27
Faculty mentor: Hui Zhang
University of Louisville, KY, USA
Research
Objective and Hypothesis
The internet
of things has numerous applications in healthcare, from remote monitoring to
smart sensors and medical device integration. It has the potential to not only
keep patients safe and healthy, but to improve how physicians deliver care as
well. Healthcare IoT can also boost patient
engagement and satisfaction by allowing patients to spend more time interacting
with their doctors. But healthcare IoT isn't without
its obstacles. The number of connected devices and the tremendous amount of
data they collect can be a challenge for hospital IT to manage, visualize, and
analyze (and sometimes, to predict).
The research objective of this project focuses on the finding of the
temporal relationship of “events” identified in the data collected from
different sources. The underlying
hypothesis is that the sequential patterns will spring from the large
amount of multi-dimensional data sources if visualized and analyzed in the
right and smart way.
Data Challenges
(slides)
·
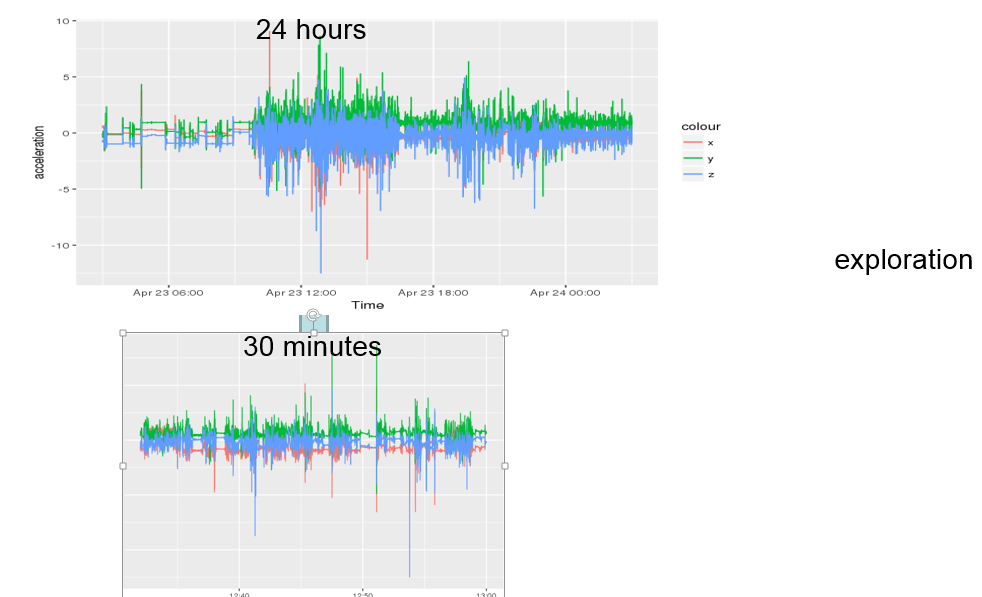
Generate
pictures for the machine generated time series data to develop hypothesis
o resolution, time scale, complexity
·
how to
analyze
o data cleansing
o feature engineering
o data science
·
performance
and scalability
Students
|
Subramanian,Ranjini
(phd student) email:
ranjini.subramanian@louisville.edu phone: (502)-974-3481 Lab: DC
236 |
Resources
·
Timeseries Datasets (will be available)
·
Sample R
notebooks
o Time
Series Analysis ARIMA basic model
o Time
series analysis on bitcoin prices data
Reading
list
·
Materials for beginners:
·
Shiny Gallery and Sample codes
·
Advanced materials:
·
Pattern mining in sequence data
·
IoT for healthcare (10 examples)
·
Practical
Time Series Analysis
Week 1 (June 18 – June 22)
Activities
|
|
June 18 |
June 19 |
June 20 |
June 21 |
June 22 |
|
9:00am - noon |
Intro/setup/training JS123 |
Common training JS123 |
Common training JS123 |
Common training JS123 |
Common training JS123 |
|
1:00pm – 4:00pm |
Lab 236 |
Lab 236 |
Lab 236 |
Lab 236 |
Lab 236 |
Task:
·
Attend morning training
·
get familiar with R by taking Datacamp Free R course.
·
Install R and RStudio (see links above) and try R programming
o Try sample R code to
create data frames
o Try
sample R code to read and write CSV files
o How to create an R
notebook on RStudio
·
Meet with Dr. Hui Zhang and Ranjini
·
Paper reading: Medical
Internet of Things and Big Data in HealthCare
Week 2 (June 25 – June 29)
Activities
|
|
June 26 |
June 27 |
June 28 |
June 29 |
June 30 |
|
9:00am - noon |
Common training JS123 |
Common training JS123 |
Common training JS123 |
Common training JS123 |
Common training JS123 |
|
1:00pm – 4:00pm |
Lab 236 |
Lab 236 |
Lab 236 |
Lab 236 |
Lab 236 |
Task:
·
Attend morning training
·
Complete Datacamp Free R course
·
Meet with Dr. Hui Zhang and Ranjini
·
Paper reading continued: Medical
Internet of Things and Big Data in HealthCare
·
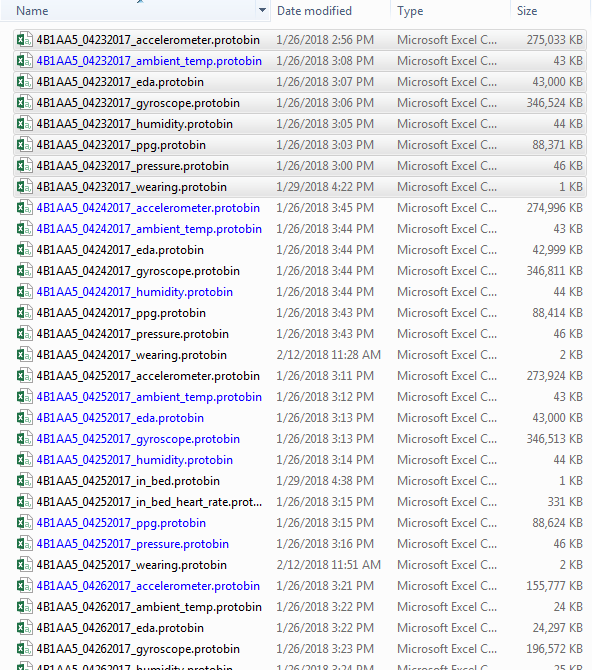
Research and hands-on experience: from raw accelerometer CSV data
to R data frame
o Sample R code for reading
and displaying CSV data
Week 3 (July 2 – July 3)Activities
|
|
July 2 |
July3 |
July 4 |
July 5 |
July 6 |
|
9:00am - noon |
Lab 236 |
Lab 236 |
Holidays |
||
|
1:00pm – 4:00pm |
Lab 236 |
Lab 236 |
|||
Task:
·
Paper reading: Health Monitoring and
Management Using IoT Sensing with Cloud-based
Processing: Opportunities and Challenges
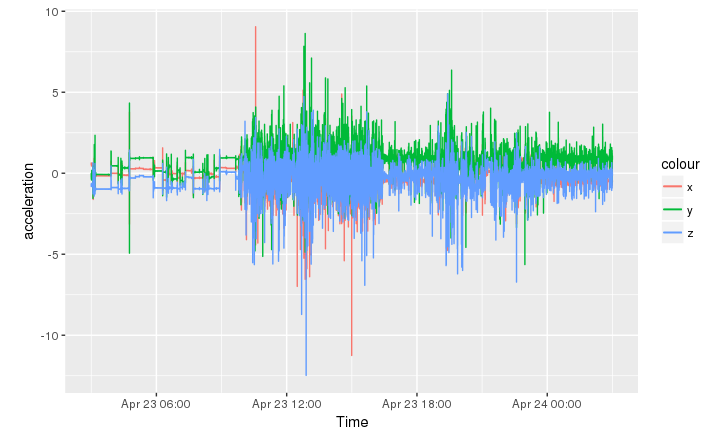
· Research and hands-on experience: convert R data frame to plotting
o Sample
R code for plotting time series
·
Meet with Dr. Hui Zhang and Ranjini (to
be scheduled)
Week 4 (July 9 – July 13) Activities
|
|
July 9 |
July10 |
July 11 |
July 12 |
July 13 |
|
9:00am - noon |
Lab 236 |
Lab 236 |
Lab 236 |
Lab 236 |
Lab 236 |
|
1:00pm – 4:00pm |
Lab 236 |
Lab 236 |
Lab 236 |
Lab 236 |
Lab 236 |
Task:
·
Paper reading: Health Monitoring and
Management Using IoT Sensing with Cloud-based
Processing: Opportunities and Challenges
· Research and hands-on experience: R interactive plotting
o Sample
R code for interactive plotting
·
Meet with Dr. Hui Zhang and Ranjini (to
be scheduled)
Week 5 (July 16 – July 20) Activities
|
|
July 16 |
July17 |
July 18 |
July 19 |
July20 |
|
9:00am - noon |
Lab 236 |
Lab 236 |
Lab 236 |
Lab 236 |
Lab 236 |
|
1:00pm – 4:00pm |
Lab 236 |
Lab 236 |
Lab 236 |
Lab 236 |
Lab 236 |
Task:
·
Paper reading: Revolutionizing
the HealthCare Industry with Big Data, Analytics, and Visualization
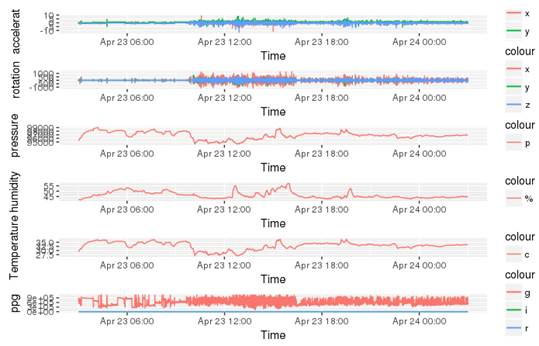
· Research and hands-on experience: plotting IoT data from multiple sources
o Sample
R code for multiple time series plotting
· Meet with Dr. Hui Zhang and Ranjini (to be scheduled)
Week 6 (July 23 – July 27) Activities
Task:
·
Paper reading: Revolutionizing
the HealthCare Industry with Big Data, Analytics, and Visualization
· Research and hands-on experience: experiment with classifying time series
o Sample
R code for machine learning
o Machine
Learning with SVM in R
· Meet with Dr. Hui Zhang and Ranjini (to be scheduled)
|
|
July 23 |
July24 |
July 25 |
July 26 |
July27 |
|
9:00am - noon |
Lab 236 |
Lab 236 |
Lab 236 |
Lab 236 |
Lab 236 |
|
1:00pm – 4:00pm |
Lab 236 |
Lab 236 |
Lab 236 |
Lab 236 |
Lab 236 |
Presentation