Active Areas
My research spans a range of topics including interactive mathematical visualization, big data visual-analysis, and multi-modal interaction; most of the areas I am actively exploring inherit a unique data-centric view and visual analysis theme, and hence its many connections with big data computing.My research in mathematical visualization has been focused on the study of interactive visualization techniques for the construction, multimodal exploration, and interactive manipulation of a wide variety of mathematical objects and phenomena. Typical geometric problems of interest to mathematical visualization applications involve both static structures, such as real or complex manifolds, and changing structures requiring interactions, such as the moves that transform one knot into an equivalent knot. The goal is to show the nature of the interrelationship between mathematics and computer science, especially computer graphics, computer haptics, and multitouch technologies. My research in this field is currently funded by NSF CAREER Award on "Visualizing Mathematical Structures in High-Dimensional Space".
Here is a selection of representative mathematical visualization projects:
-
Our first example concerns multimodal exploration of the fourth dimension. People learn about the everyday world by combining different sensory modalities. In particular, knowledge of shape comes from a combination of sight, touch, and exploration. By combining computer graphics with computer haptics, which imitate the 3D sense of touch, we can provide multimodal exploration tools that can in principle improve on real life. To see how this improvement is possible, imagine that you have a real, physical rope that is tied in a knot. Your view of the rope is interrupted where one part crosses another. If you try to trace the rope with a fingertip, your finger will eventually collide with another part of the rope, interrupting its smooth passage. With a touch-based computer interface, however, there are no physical obstructions to the motion of a pictured ‘computer hand,’ and the entire rope (or any other object) can be traced without the interruptions imposed by sight or a real physical obstruction.
We can use the same methods of this touch-based multimodal paradigm to help us understand and manipulate the much more complicated case of shapes with self-intersecting surfaces, which arise naturally when projecting objects from 4D down to 3D. If sound cues are added to describe the passage of the computer hand across a visual obstruction, one can explore a knot or a surface without necessarily having to use vision at all. When used in combination with a visual representation, the auditory cues provide additional redundant feedback, which can improve the intuitive perception of spatial structure. One basic achievement of this research is to exploit the free motion of a computer-based haptic probe to support a continuous motion that follows the local continuity of a 4D surface, allowing collision-free exploration in the 3D projection of the surface. In 3D, this interactive probe follows the full local continuity of the surface as though we were physically touching the actual static 4D object (see Figure 1).
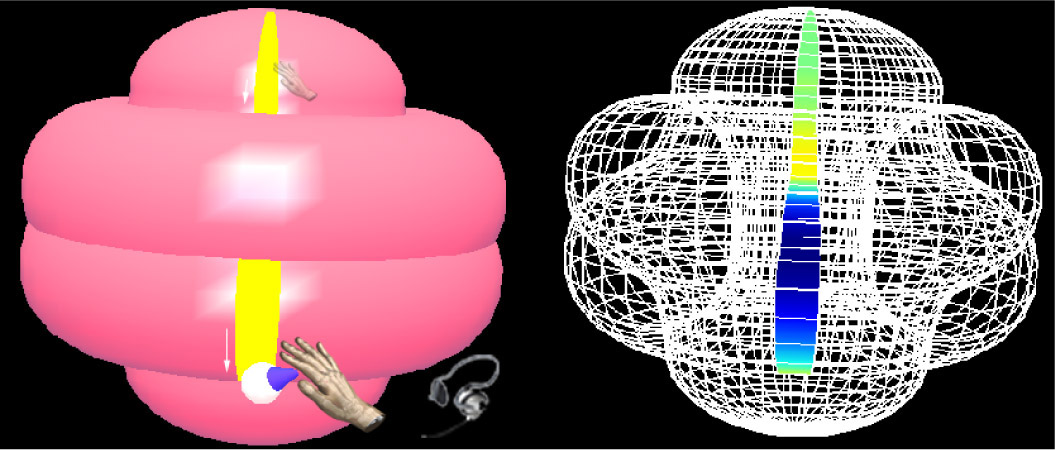
Figure 1. Multimodal perceptual exploration of a shape known as the spun trefoil (a knotted sphere embedded in 4D) projected down to 3D. See video for the exploration of a 4D torus. -
Our second example of visualization applications concerns knot theory, which lies at the crossroads of mathematics and physics.In knot theory, two knots are considered to be the same if one knot can be distorted into the other without breaking it, much as we might physically play with a real knotted rope where one part cannot physically intersect or pass through another. (In general, knot theory considers the ‘ropes’ to be closed loops, unlike a real piece of rope with free ends.) Mathematicians represent knots with 2D diagrams (a projection down from three-space, where the knots exist) in which the lines cross over one another. The equivalence relation among knots is mathematically generated on knot diagrams by a sequence of moves of the lines and the crossing points called Reidemeister moves.A Reidemeister move (see Figure 2) is one of three kinds of moves that is performed on a local part of a knot diagram without changing the rest of the diagram. These three Reidemeister moves are representative (they generate all possible ways to change a knot diagram while still representing the same topological knot) and are useful for doing combinatorial topology of both knots and related mathematical objects called links. By applying the Reidemeister moves, we can gain insights into the underlying topological structure of a knot by obtaining a continuous family of embeddings of circles in three-space from one knot to its equivalent.
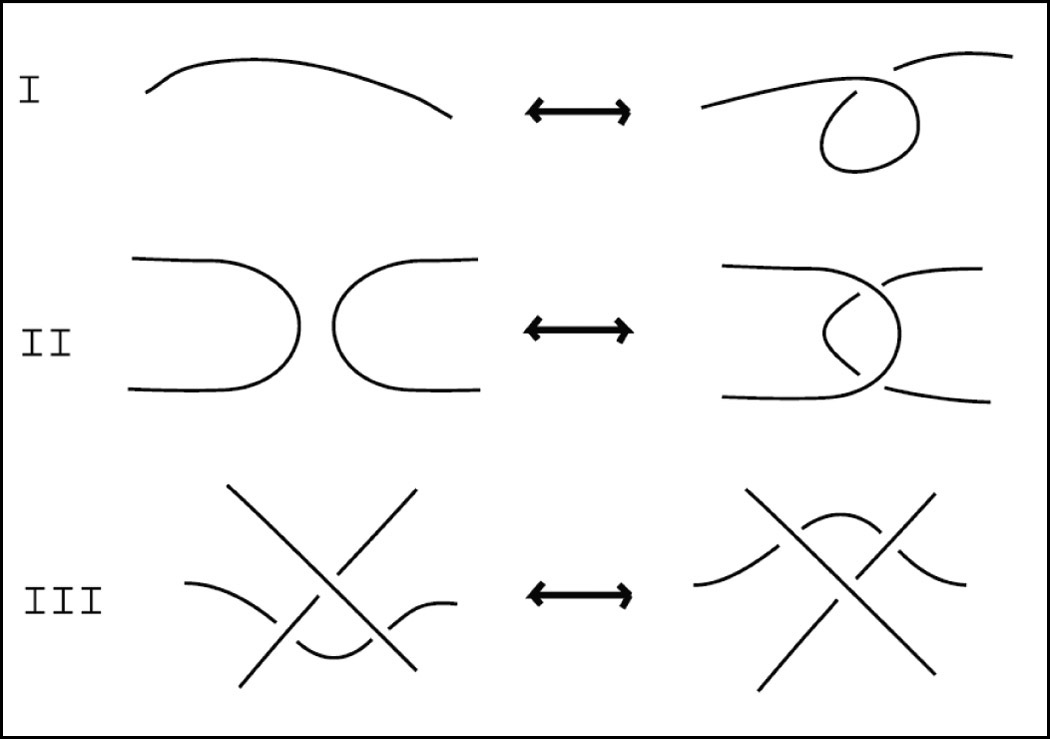
Figure 2. The three Reidemeister moves, which relate equivalent knot diagrams. Each move operates on a small region of a knot diagram. (I) Twist or untwist in either direction. (II) Move one loop completely over another. (III) Move a string completely over or under a crossing. We developed an application called KnotPad, an interactive paper-like system for visualizing and exploring mathematical knots (see Figure 3). We exploited topological drawing and math-aware deformation methods in particular to enable and enrich our interactions with knot diagrams. Whereas most previous efforts typically employ physical-based modeling to simulate the 3D dynamics of knots and ropes, our tool offers a Reidemeister-move-based interactive environment that is much closer to the topological problems being solved in knot theory, yet without interfering with the traditional advantages of paper-based analysis and manipulation of knot diagrams. Drawing knot diagrams with many crossings and producing their equivalents is quite challenging and error-prone. KnotPad can restrict the user's manipulations to the three types of Reidemeister moves, resulting in a more fluid and mathematically correct experience with knots.
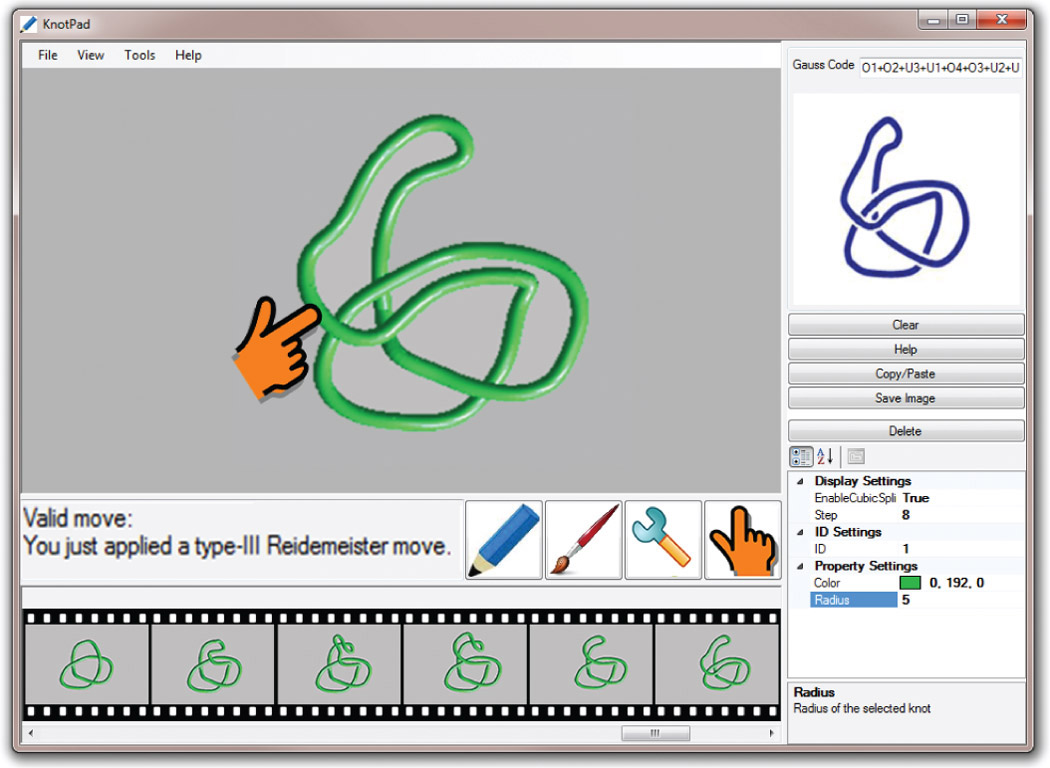
Figure 3. The supported manipulations in KnotPad are based on the three types of Reidemeister moves. This tool allows users to produce and trace equivalent knot diagrams by verifying the mathematically valid moves and recording their sequence. KnotPad permits us to draw mathematical knots and edit their diagrams. Furthermore, we exploit supplementary interface elements to enrich the user experience. For example, this application allows one to pull and drag on knot diagrams to produce mathematically valid moves. Navigation enhancements provide further improvement: by remembering and displaying the sequence of valid moves applied during the entire interaction, KnotPad allows a much cleaner exploratory interface for the user to analyze and study knot equivalence.
-
The final example concerns our work to redesign mathematical visualization interfaces to exploit multitouch input. For instance, proposing a Reidemeister move requires operating on a small region of the diagram while keeping the rest of the knot representation unchanged. Such manipulations can often be more facile and satisfying by using multifinger manipulations (see Figure 4). Figure 5 shows screen images of a trefoil-type knot diagram being manipulated with multitouch gestures. This interface leverages the traditional advantages of paper-based analysis and multifinger manipulation. Interactive visualization, a 2D sketch-like interface, and multitouch technologies combine to reveal the complex spatial relationships of mathematical knots with a mathematically true user experience.
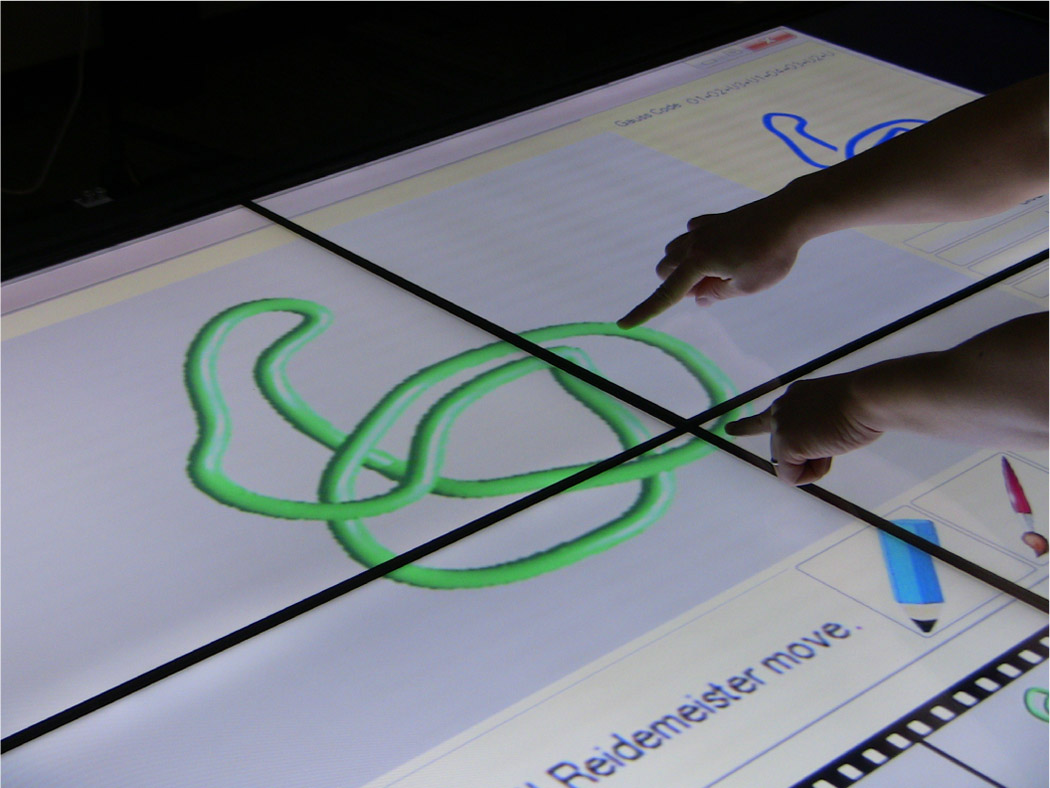
Figure 4. Mastering mathematical knots with multitouch on a multitouch tabletop. 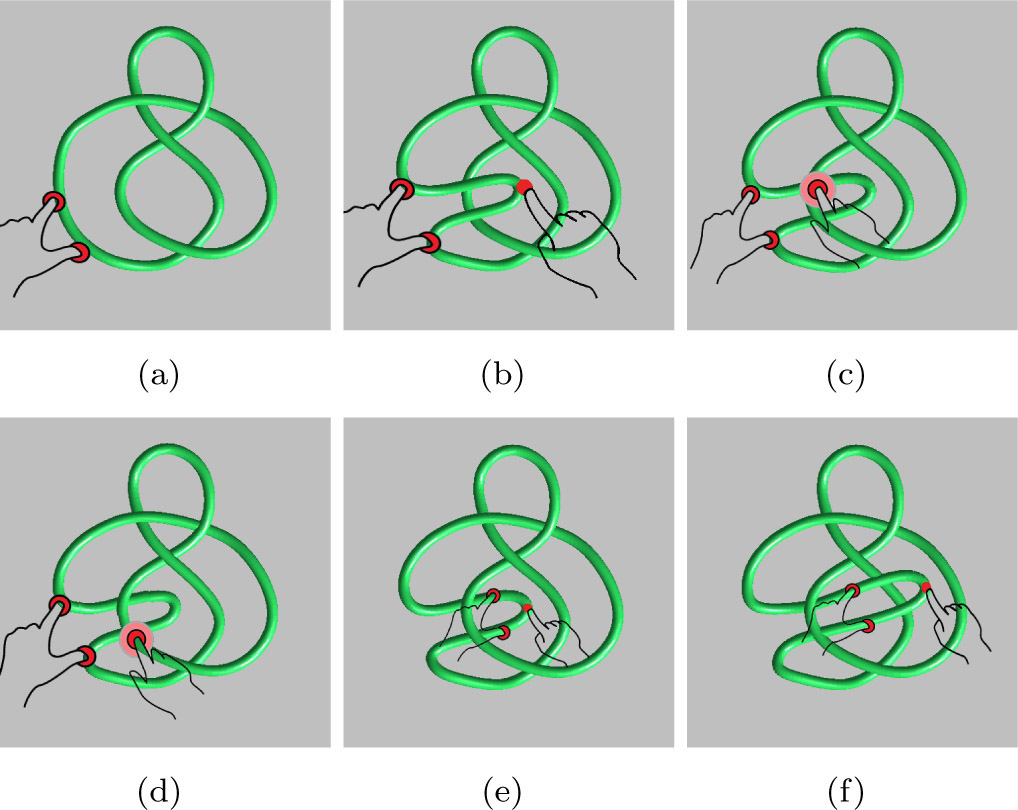
Figure 5. Using multitouch gestures to pull a local part of a knot diagram to create Reidemeister moves. Applying a type-II Reidemeister move with (a) two-finger hold plus (b) one-finger drag. Finalizing crossing signs with two-finger hold plus one-finger double-tap (c, d). Applying another type-II Reidemeister move with (e) two-finger hold plus (f) one-finger drag.
Mathematical visualization is the art of creating a tangible experience with abstract mathematical objects and concepts. While this process has been a cornerstone of the mathematical reasoning process since the times of the ancient geometers, the advent of high-performance interactive computer graphics systems has opened a new era whose ultimate significance can only be imagined.
Representative publications:
- H. Zhang, J. Weng, & A. Hanson. A Pseudo-haptic Knot Diagram Interface. Proc. SPIE 7868, Visualization and Data Analysis 2011, 786807 (January 24, 2011. San Francisco, California. January 23, 2011.
- H. Zhang, J. Weng, L. Jing, & Y. Zhong. KnotPad: Visualizing and Exploring Knot Theory with Fluid Reidemeister Moves. VisWeek/SciVis 2012. Seattle, WA. IEEE Transactions on Visualization and Computer Graphics (TVCG), Volume 18, Issue 12. (Dec 2012). pp 2051-2060
- H. Zhang, & A. Hanson. Shadow Driven Haptic 4D Visualization. IEEE TVCG November/December 2007 (Vol. 13, No. 6) pp. 1688-1695.
- A. Hanson, & H. Zhang. Multimodal Exploration Of The Fourth Dimension. In Proceedings of IEEE Visualization, pages 263-270, 2005.
A major portion of our problem solving visual-analytics applications revolve around important domain-specific and policy-relevant problems, which often require novel approaches to the modeling, analysis, and processing of large heterogeneous and creative sources of data. Most current research in this area also focus on the principled approaches to big data analytics with a focus on the development of scalable techniques that are efficient for advanced computing infrastructures.
-
Our first example concerns the application of HPC resources and data science methods in the intensive longitudinal caries lesion assessment, a collaborative effort with IU School of Dentistry. Dental caries, also known as tooth decay or a cavity, is an infection, usually bacterial in origin, which causes demineralization of the hard tissues (enamel, dentin and cementum) and destruction of the organic matter of the tooth. The caries process is preventable, interruptible, and sometimes reversible with treatments. Most investigations therefore focus on detecting and assessing the dynamic caries lesion activities, based on large-scale dental scan images and intensive longitudinal data analyses to construct quantitative 3D volumetric information over time (see Figure 1). The study is data-driven and computationally demanding. It involves segmenting high-resolution µ-CT images, constructing 3D models suitable for interactive visualization, and analyzing 3D and 4D (3D + time) dental images.
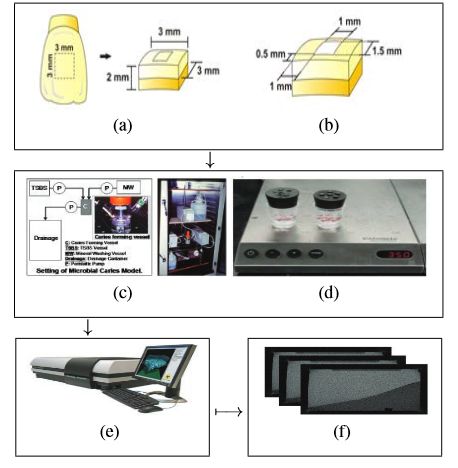
Figure 1: (a) Schematic diagrams showing specimen dimension. (b) Region of interest (ROI). (c) Demineralization is done by acid-producing bacterial metabolism (pathological factors) (d) Remineralization is done by fluoride treatment and plaque control (protective factors). (e) During the caries process, a large amount of high-definition high-quality SkyScan microfocus-CT images are scanned from tooth specimens. (f) Cross-sectional images obtained from specimen during the entire caries pro-cess. Our basic achievement exploits image processing algorithms and the data parallel approach to utilize XSEDE's high performance computing resources for multi-core image processing and 4D dental image generation. Building on the computational algorithms and data parallel implementation models, we recently map the longitudinal caries lesion assessment problem into a MapReduce distributed computing model, which centers around Map and Reduce functions to perform image understanding and 3D reconstruction tasks(see Figure 2). This workflow enables quantitative analysis as well as three-dimensional comparison of multiple temporal datasets from the longitudinal dental research studies. Such quantitative assessment and visualization can help us to understand and evaluate the underlying processes that arise from dental treatment, and therefore can have significant impact in the clinical decision-making process and caries diagnosis (see Figure 3).
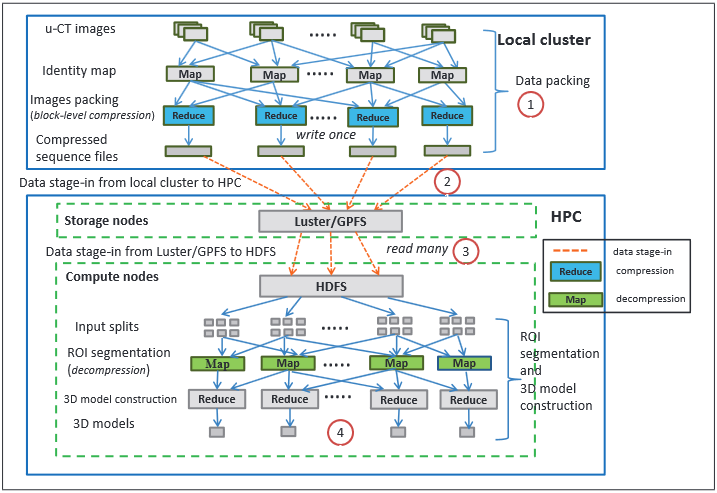
Figure 2: Workflow of MapReduce based 3D time series analysis of caries lesion activity. (1)µ-CT images are packed into large sequence files using block-level compression on local cluster (write once process). (2) Sequence files are staged in from local cluster to Luster/GPFS on HPC. (3) Sequences files are staged in from Luster/GPFS hosted by storage nodes to HDFS co-located with compute nodes for each run/analysis (read many process). (4) Analysis of caries lesion activity conducted on MapReduce cluster. 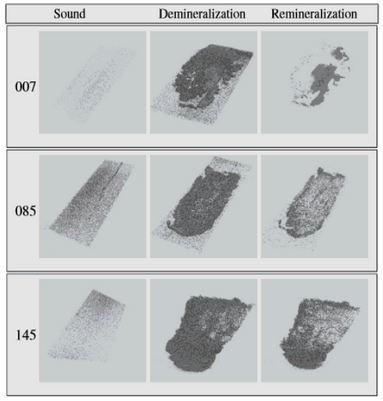
Figure 3: Examples of 3-Dimensional images of all groups for three periods. Light gray line box indicates the region of interest (ROI: 3.7X2.8X0.6mm). Darker gray inside (or within) the ROI represent mineral content between 87 to 30% of sound gray scale. -
Our second example of data intensive analysis applications concerns high-frequency financial statistics using a combination of data parallel approaches and hardware acceleration. Financial statistics covers a wide array of applications in the financial world, such as (high frequency) trading, risk management, pricing and valuation of securities and derivatives, and various business and economic analytics. In financial risk management, the question of how to allocate assets in a large portfolio is of utmost interests to most investors. It is necessary to understand the returns to expect from the portfolio, in addition to the volatility the portfolio can experience about that expectation. The portfolio allocation problem typically involves dividing an investment portfolio among different assets based on the volatilities of the asset returns. The most challenging part is the tremendous amount of data and the optimization procedures such as LASSO and SCAD involve large-scale computations. Usually the data issue can be remedied by using some cloud storage and special data management and processing in SAS. The computation part is extremely time-consuming if it’s done on a personal PC. However, we note that the Monte Carlo simulation and optimization proceed by generating grids over a certain range of the tuning parameter c and ? over each individual trading day, and then repeat this optimization for K times. Assuming the return level is uncorrelated over time, we can distribute the optimization for each day to different CPUs on different computers using embarrassingly parallel technique. For further performance gain, we adopt special purpose architecture, the Intel Many-Integrated-Core architecture on XSEDE Stampede supercomputer, to offload the linear algebra operations to Phi coprocessor. The data parallel and massive parallelism through hardware acceleration combine to reduce the estimated 50000-hour processing time down to 6.7 hours on Stampede supercomputer.
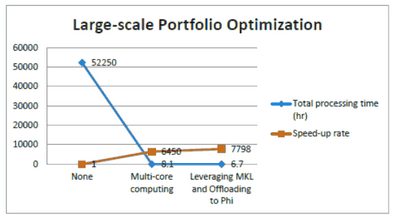
Figure 4: Performance improvement of repeating optimization for 500 times stepping through 209 trading days. -
Our final example focuses on the interactivity and effective integration of techniques from data mining, visualization and big data analysis. Domain research is becoming more data-intensive as researchers are generating and using increasingly large, complex, and diverse data sets. This era of "Big Data" taxes the ability of domain researchers to locate, analyze, and interact with these data at scale. The basic problem is that, traditional machine learning algorithm and data mining techniques help people gain significant insights into a wide range of scientific problems, often by means of iterative machine computation and interactive visualization. However, as datasets are being generated in larger volumes, higher velocity, and greater variety, creating effective interactive data mining and explorative analysis techniques becomes a much harder task. There is few technologies that allow us to freely “wander” around the data and explanatively analyze datasets at scale.
Towards this goal; we researched and developed a parallel computing solution using R on a web interface (PCRWeb). This parallelization-aware interactive framework focuses on the interactivity and the effective integration of techniques from data intensive analysis, visualization and human computer interaction. Interactive data mining techniques have been proved to aptly integrate human intuition through the visualization and human-in-the-loop paradigm. PCRWeb scales explorative analysis paradigm to large-scale analytics using R with a combination of remote visualization, configurable web user interface, and multi-core computing.
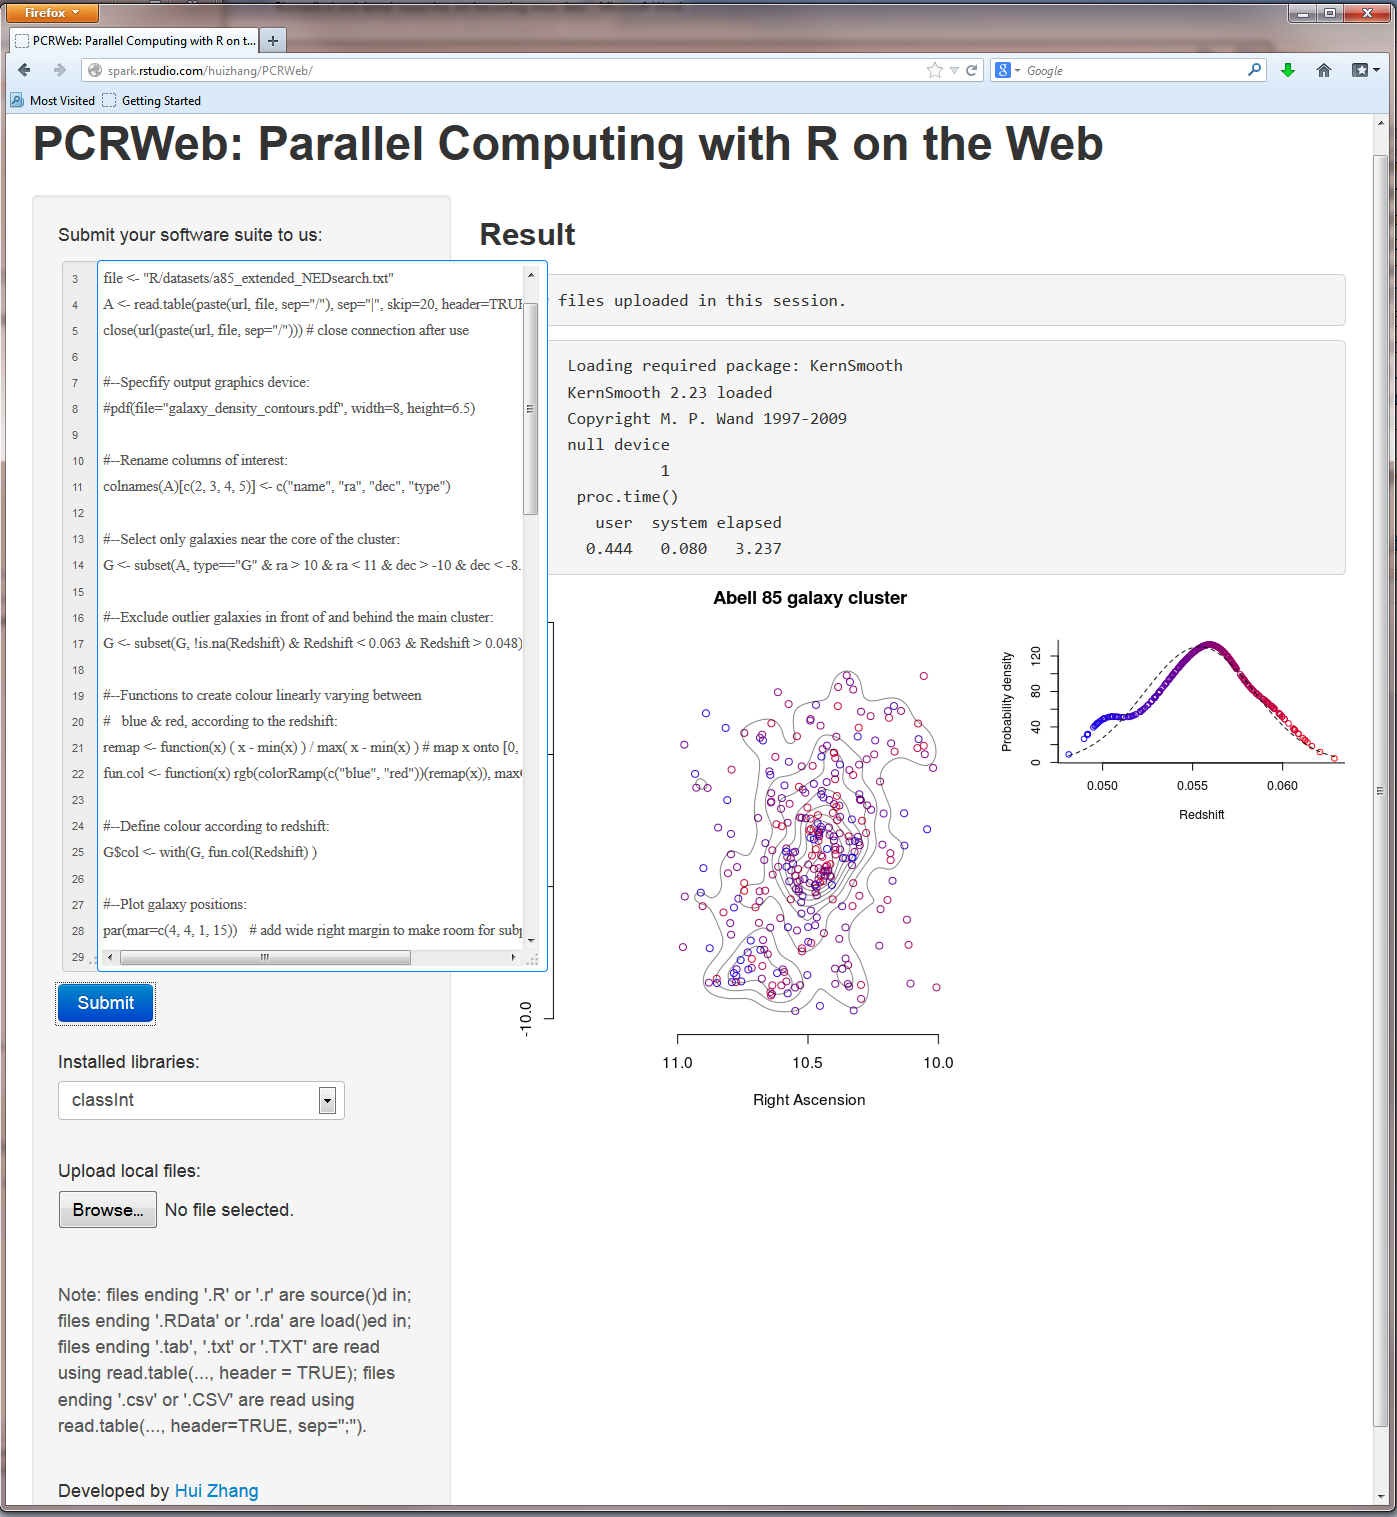
Figure 5: PCRWeb - Parallel Computing with R on the Web.
Representative publications:
- Y. El-Khamra, N. Gaffney, D. Walling, E. Wernert, W. Xu, H. Zhang. Performance Evaluation of R with Intel Xeon Phi Coprocessor. In Proceedings of the First Workshop on Benchmarks, Performance Optimization, and Emerging hardware of Big Data Systems and Applications (BPOE 2013), in conjunction with 2013 IEEE International Conference on Big Data (IEEE Big Data 2013). October 8, 2013, Silicon Valley, CA, USA.
- H. Zhang, J. Weng, L. Jing, & Y. Zhong. KnotPad: Visualizing and Exploring Knot Theory with Fluid Reidemeister Moves. VisWeek/SciVis 2012. Seattle, WA. IEEE Transactions on Visualization and Computer Graphics (TVCG), Volume 18, Issue 12. (Dec 2012). pp 2051-2060
- H. Zhang, G. Ruan, H. Shen, M. Bolyes, H. Li, M. Ando. XSEDE-Enabled High-Throughput Lesion ActivityAssessment. In Proceedings of the Conference on Extreme Science and Engineering Discovery Environment: Gateway to Discovery(XSEDE '13). ACM, New York, NY, USA, Article 10.
- G. Ruan, H. Zhang, B. Plale. Exploiting MapReduce and Data Compression for Data-intensive Applications. In Proceedings of the Conference on Extreme Science and Engineering Discovery Environment: Gateway to Discovery (XSEDE '13). ACM, New York, NY, USA, Article 38.
- H. Zhang, M. Ando, & M. J. Boyles. 3D-Time Series Analysis of Caries Lesion Activity for Oral Health Care. In Proceedings of the Workshop on Visual Analytics in Healthcare (VAHC 2012). (Inconjunction with the IEEE VisWeek 2012, Oct 17th, Seattle, WA.)
Early research in this area has been focused on the study of gesture, speech and gaze in human-avatar multimodal discourse. The study of multimodal interaction ultimately requires an understanding of the temporal events in the multimodal behavioral events such as head turn, pointing, eye gaze, and joint attention. The underlying hypothesis is that the joint behavior and associated rules can be analyzed from the multimodal data set. A major portion of the current research revolves around the modeling a social agents with real-time responsive behaviors, the building of real-time multi-modal systems, and computational methods to visualize and analyze events and phenomena in multimocal interactions.
Representative projects are as follows:
-
Modeling Real-time Multimodal Interaction with Virtual Humans. Natural social interactions can be very complex and comprise multiple levels of coordination, from high level linguistic exchanges, to low level couplings and decouplings of bodily movements. A better understanding of how these are coordinated can provide insightful empirical data and infer useful principles to guide the better design of human-computer interaction interface. In light of this, we propose and implement a research framework to model real-time multimodal interaction between real people and virtual humans. The value of doing this is that we can systematically study and evaluate different important aspects of multimodal real-time interactions between human and virtual agents (Figure 1). Our platform allows the virtual agent to keep track of the user’s gaze and hand movements in real time, and adjust his own behaviors accordingly. Multimodal data streams are collected in human-avatar interactions including speech, eye gaze, hand and head movements from both the human user and the virtual agent, which are then used to discover fine-grained behavioral patterns in human-agent interactions (see e.g., Figure 2).
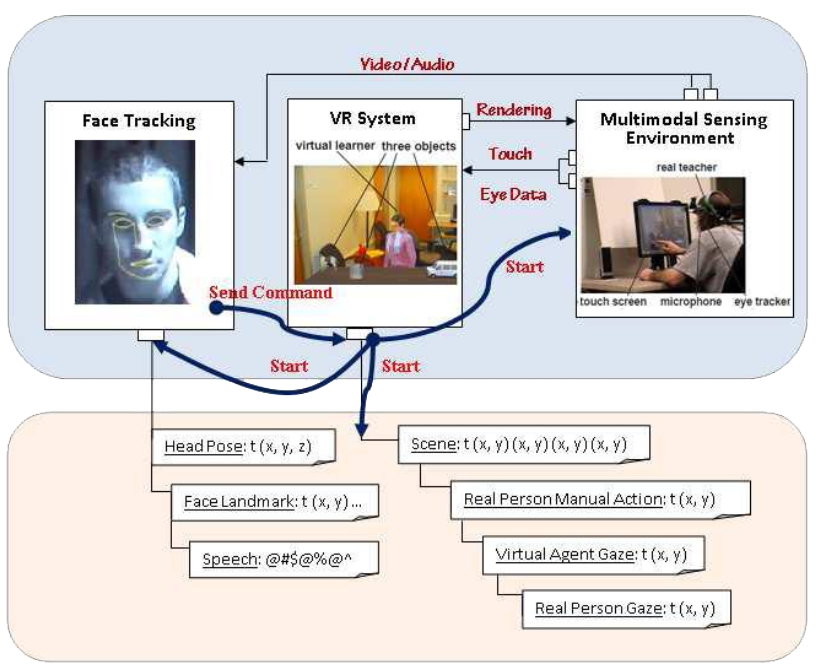
Figure 1: An overview of system architecture. Top: A real person and a virtual human are engaged in a joint task with a set of virtual objects in a virtual environment. Bottom: multiple data streams are recorded from human-avatar interactions which are used to discover fine-grained behavioral patterns and infer more general principles. 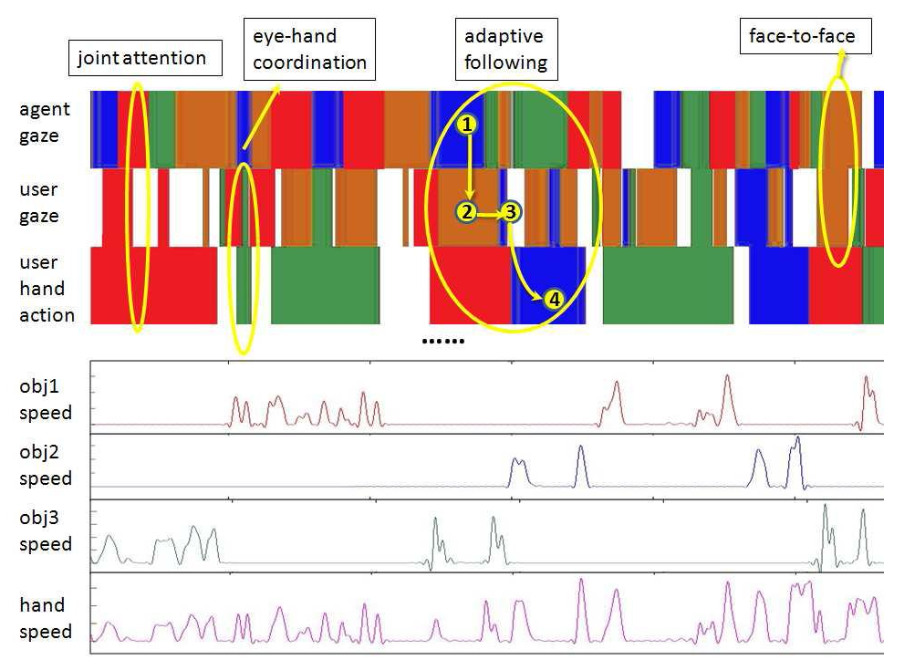
Figure 2: Visual-analysis of interactive behavioral patterns in multimodal data streams. -
Sequential Pattern Mining of Multimodal Data Streams in Human-Robots Interaction. To better identify and understand the micro-level behavioral patterns in human-robot interactions, we developed a sequential pattern mining method to analyze multimodal data streams using a quantitative temporal approach. Our method is equipped with the capability of exploring representative real-valued interval-based events; we applied our method with its application to the detection and extraction of human sequential behavior patterns over multiple multimodal data streams in human-robot interactions (Figure 3). Experimental results confirmed the feasibility and quality of our proposed pattern mining algorithm (see Figure 4), and suggested a quantitative data-driven way to ground human-human and human-robot interactions in a manner that has never been achieved before.
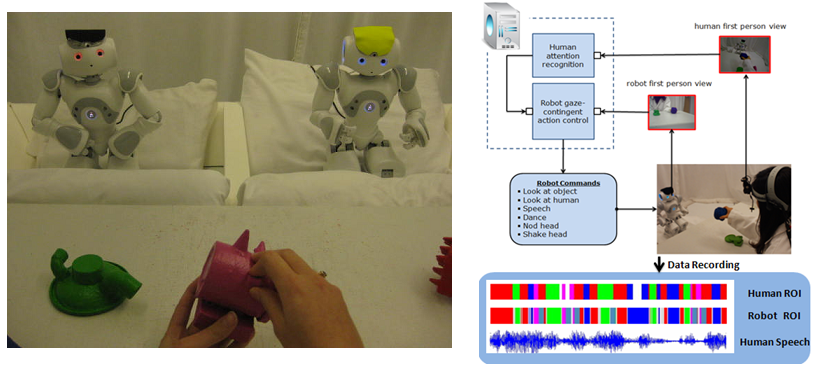
Figure 3: A participant and the robot sat across the table and interacted with each other in a shared environment. The human teacher attempted to teach the robot a set of (artificial) objects to the robot, and the robot generated gaze-contingent responsive behaviors based on the real-time detection of the human teacher’s attention. In addition, multiple data streams were recorded to analyze human behaviors in this joint task. 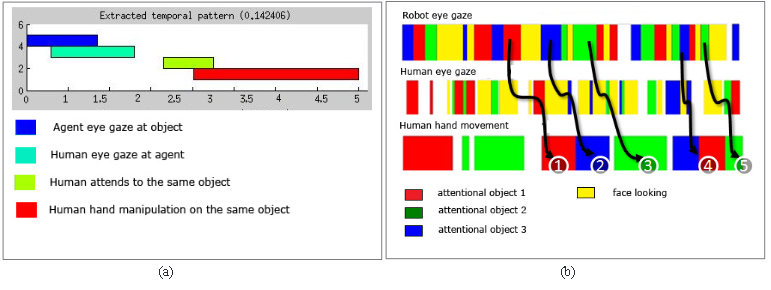
Figure 4: An example of interactive behavioral pattern. (a) The sequential pattern starts with a situation when the robot is not engaged, then the human re-engages the robot by first looking at the robot’s face, followed by a joint attention, then the human manipulates the object in his hand to try to attract the robot to reach his attention. (b) Instances of the sequential pattern are identified in the multimodal stream visualization. -
Visual Programming Interface for Human-Robot Interaction Studies. The study of multimodal interactions is often concerned with manipulations of multi-modal signals, events, and commands that form various kinds of interaction rules. Depicting, manipulating and sharing such design-level information is a compelling challenge. Furthermore, the closed loop between HRI programming and knowledge discovery from empirical data is a relatively long cycle. This, in turn, makes design-level verification nearly impossible to perform in an earlier phase. In this project We investigated a novel interaction paradigm for the visual exploration, manipulation and analysis of human-robot interaction rules; our development is implemented using a visual programming interface and exploits key techniques drawn from both information visualization and visual data mining to facilitate the interaction design and knowledge discovery process. More specifically, we exploit a drag-and-drop user interface and visual languages to support depicting responsive behaviors from social participants when they interact with their partners. For our principal test case of gaze-contingent HRI interfaces, this permits us to program and debug the robots’ responsive behaviors through a graphical data-flow chart editor. We also exploit additional program manipulation interfaces to provide still further improvement to our programming experience: by simulating the interaction dynamics between a human and a robot behavior model, we allow the researchers to generate, trace and study the perception-action dynamics with a social interaction simulation to verify and refine their designs. Finally, we extend our visual manipulation environment with a visual data-mining tool that allows the user to investigate interesting phenomena such as joint attention and sequential behavioral patterns from multiple multi-modal data streams. We have created instances of HRI interfaces to evaluate and refine our development paradigm.
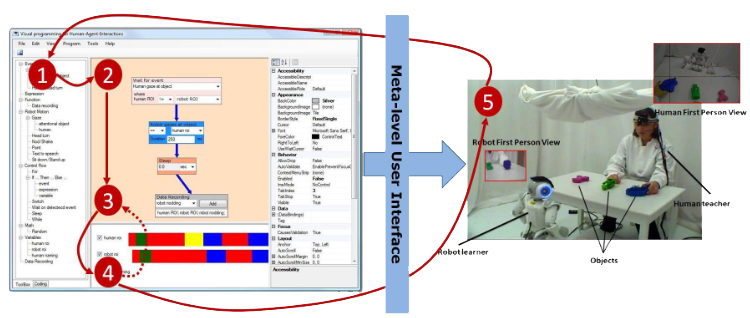
Figure 5: Transforming HRI designs in our meta-level user interface in to experimental studies: (1) drag and drop variables, commands, functional units from a toolbox to a graphical flow-chart editor; (2) explore, design, and composite program objects into rules of various kinds; (3) construct executable interaction flow with our program manipulation paradigm; (4) trace, investigate the perception-action dynamics between a human and a robot behavior model, and refine behavior design inspired by visualization; (5) acquire empirical data in HRI studies including a robot with programmed interaction rules, and gain insights to lead to the next round of behavioral study.
Representative publications:
- L. Xu, H. Zhang, & C. Yu. Cooperative Gazing Behaviors in Multi-robot Human Interaction. Journal of Interaction Studies, Volume 14, Issues (14:3)(in press).
- H. Zhang, & M. J. Boyles. Visual exploration and analysis of human-robot interaction rules. Proc. SPIE 8654, Visualization and Data Analysis 2013, 86540Z (February 4, 2013); doi:10.1117/12.20028215.
- H. Zhang, D. Fricker, T.G. Smith, & C. Yu. Real-Time Adaptive Behaviors in Multimodal Human-Avatar Interactions. In Proceedings of ACM 12th International Conference on Multimodal Interfaces and 7th Workshop on Machine Learning for Multimodal Interaction (ICMI-MLMI 2010).
- H. Zhang, D. Fricker, & C. Yu. A Multimodal Real-Time Platform for Studying Human-Avatar Interactions. In Proceedings of 10th International Conference on Intelligent Virtual Agents (IVA 2010).